
Developed market central banks are nearing the end of their tightening cycles. For now, market consensus points to a mild contraction in the US in late 2023 and slow growth in developed markets. But given the historical lag between monetary policy and economic performance, investors are wary that a hard landing may be still to come.
In this context and following gold’s positive returns in H1, we expect gold to remain supported on the back of rangebound bond yields and a weaker dollar. Gold should experience stronger investment demand if economic conditions deteriorate. Conversely, a soft landing or much tighter monetary policy could result in disinvestment.
Gold in the top tier
In the first half of the year, gold increased by 5.4% in USD – closing June at US$1,912.25/oz. Gold outperformed all other major assets apart from developed market stocks (Chart 1).
Gold not only contributed positive returns to investor portfolios, it also helped dampen volatility throughout H1, especially during the mini-banking crisis in March.
Behind gold’s performance was a combination of factors:
• a relatively stable US dollar and interest rates
• event risk hedging
• continued central bank demand.
Figure 1: There’s potential upside for gold in 2023, but risks persist
Gold’s indicative performance based on various hypothetical scenarios*
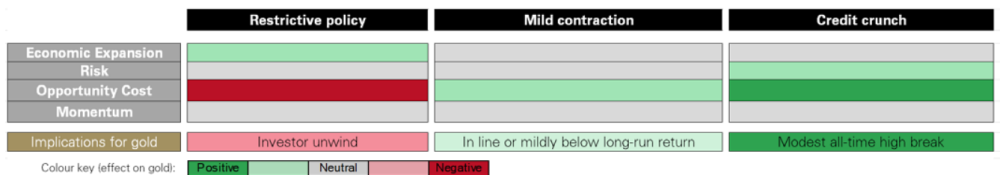
*See Figure 2 for a detailed review of the macroeconomic and financial conditions of each scenario. Analysis based on WGC’s Gold Valuation Framework. For equivalent scenarios based on Oxford Economics data, visit Qaurum.
Chart 1: Gold has been a top performing asset in 2023
Y-t-d return in USD of major assets*
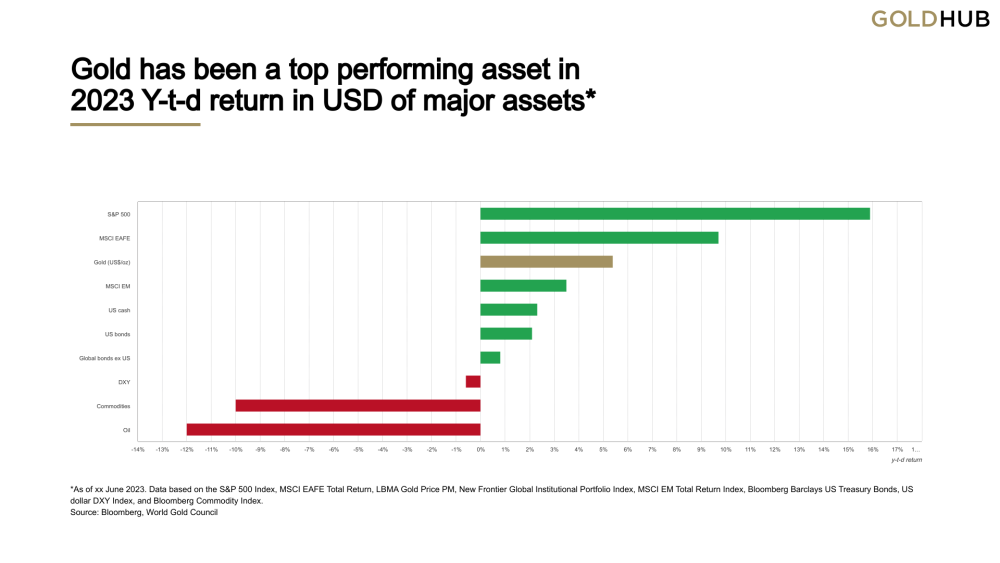
*As of 30 June 2023. Data based on the S&P 500 Index, MSCI EAFE Index, LBMA Gold Price PM, MSCI EM Index, ICE BofA US 3-month T-Bill Index, Bloomberg US Bond Agg, Bloomberg Global Bond Agg ex US, US dollar DXY Index, Bloomberg Commodity Index, and Oil WTI Spot.
End of Tightening in sight
Both the European Central Bank (ECB) and the Bank of England (BoE) increased interest rates in June, but the US Fed kept its target rate unchanged as it lets the effects of the tightening cycle make their way through the real economy. US bond market participants expect an additional hike by the Fed this year, most likely in July, followed by a sustained ‘hold’ period. And while bond markets expect the ECB and the BoE to further increase target rates, markets anticipate the end of the cycle is near – or at least it will be by the end of the year.
As monetary policy likely transitions from tightening to on-hold, market consensus is for a mild contraction in the US this year, and slow growth in developed markets.
Should this scenario play out, our analysis suggests that gold will remain supported in 2023, especially given its robust performance in H1. But it may not break out significantly from the range we have seen so far this year.
This is a by-product of the four key drivers that determine gold’s performance (Figure 2):
• economic expansion
• risk
• opportunity cost
• momentum.
While slow economic growth in the West may have a negative effect on consumer spending, we anticipate that the Indian economy will hold up better and China will respond to potential economic stimulus later in the year providing some support to local demand.
In addition, despite signs of cooling inflation, the combination of stock market volatility and ‘event risk’ (such as geopolitical or financial crisis) is likely to keep hedging strategies, including gold, in place.
Further, based on market consensus expectations, slightly lower interest rates and a weakening US dollar will help gold by reducing its opportunity cost for investors. This is consistent with the previous hold cycles, which have lasted between six and 12 months. During these periods gold had an average monthly return of 0.7% – equivalent to an 8.4% annualised return and above its long-term average. As we have discussed in the past, gold is usually influenced by bond yields rather than actual policy rates, as the former include market expectations of future policy decisions and the likelihood of a subsequent recession.
With monetary policy so tight, many investors are also looking at the Institute for Supply Management (ISM) Purchasing Manager’s Indexes (PMIs) as signals of future weakness. Indeed, developed market PMIs (both manufacturing and services) have been deteriorating in recent months.
Figure 2: Detailed macroeconomic scenarios for H2 2023
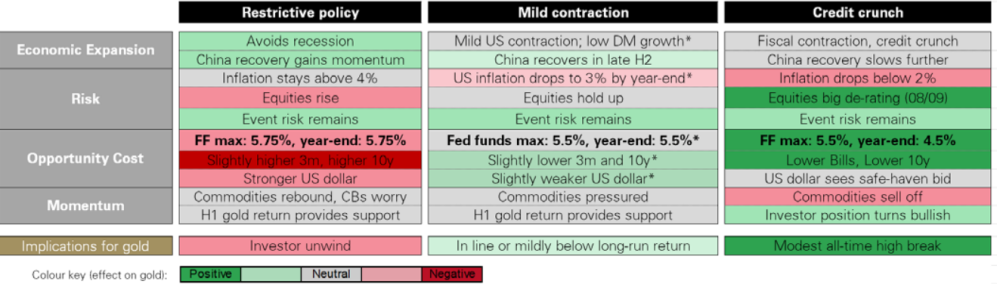
*Corresponds to Bloomberg consensus as of 30 June 2023. Fed funds (FF) refers to the upper bound Fed funds target rate. DM stands for developed markets. Gold implications based on Gold Valuation Framework. Equivalent hypothetical scenarios also available at Qaurum.
Chart 2: Gold has had a positive average return in periods when the Fed is on hold
Gold monthly returns during Fed on-hold periods*
Sources: Bloomberg, World Gold Council; Disclaimer
*As of 30 June 2023. On hold periods include: 6/2000–12/2000; 7/2006–8/2007; and 1/2019-6/2019.
Our analysis shows that gold tends to outperform equities when manufacturing PMI is below 50 and falling (Chart 3). Further, if PMI falls below 45, history suggests gold’s outperformance may be even more pronounced. And while gold has underperformed against equities if manufacturing PMI is below 50 but rising, it has still delivered positive returns, showcasing the asymmetrical benefits it tends to bring to portfolios.
Chart 3: Gold outperforms stocks in periods when PMI declines but still captures the upside if it rises
3-month forward returns for gold and stocks when ISM manufacturing PMI is below 50*
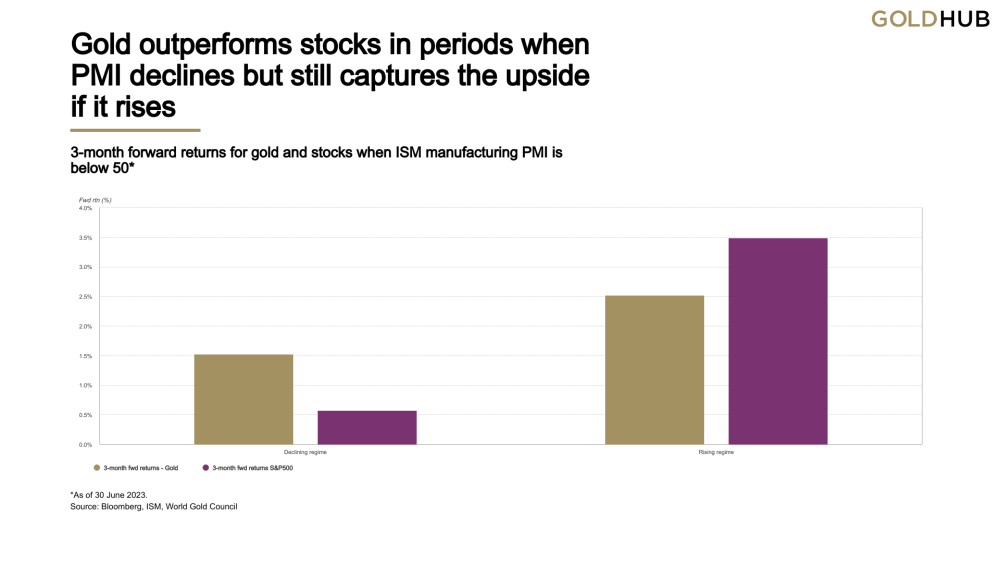
*As of 30 June 2023.
Upside with risks
If the recession risk increases, gold investment could see greater upside. An economic deterioration could be driven by a significant increase in defaults following tighter credit conditions or other unintended consequences of the high-rate environment. Historically, such periods have resulted in higher volatility, significant stock market pullbacks, and an overall appetite for high quality, liquid assets such as gold (Chart 4).
Chart 4: Gold has historically performed well during recessionary periods
Gold and the USD during recessions*
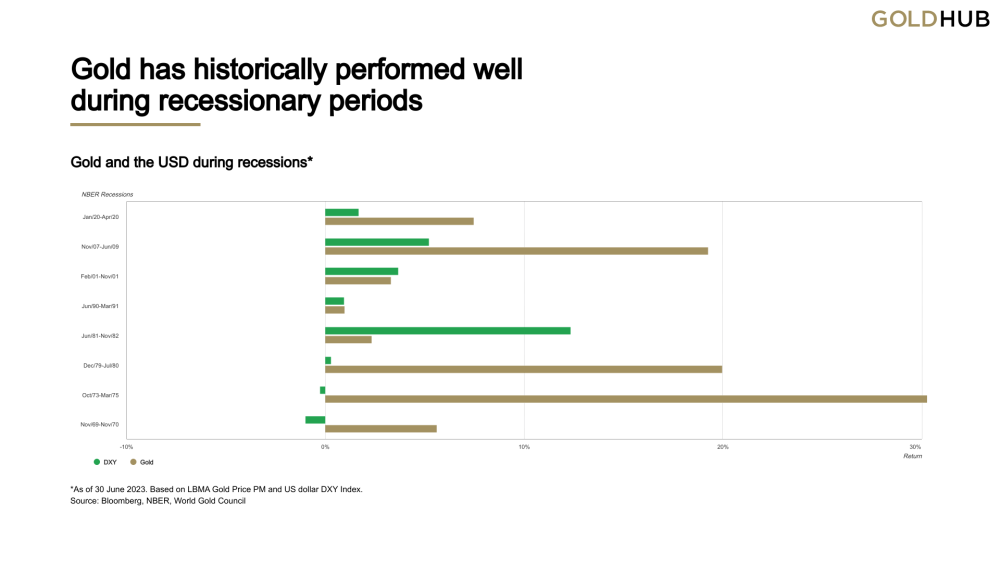
*As of 30 June 2023. Based on LBMA Gold Price PM and US dollar DXY Index.
On the flipside, expectations of a soft landing – where a recession is avoided but monetary policy remains tight – could create headwinds for gold and result in disinvestment. For example, gold ETFs saw sizable outflows in June and gold holdings have fallen year-to-date.
It is worth noting, however, that given gold’s positive performance in H1, an investor unwind would need to be severe to result in the average 2023 gold price falling below US$1,800/oz – its 2022 average.
Asymmetrical benefits
As investors assess the impact of restrictive monetary policy and the possibility of a recession, they often dial up defensive strategies in their asset allocation.
For example, a common approach is to rotate part of the equity exposure into defensive sectors to limit losses during a significant market drawdown.
To illustrate this, we compare two hypothetical defensive strategies. One where 20% of the equity allocation is invested in defensive sectors, and one where 10% is invested in defensive sectors and 10% in gold (Table 1).
Our analysis shows that, over the past 25 years, the strategy including gold would have improved returns, while reducing volatility and drawdown.
Table 1: Gold may help improve defensive strategies
Comparison of hypothetical investment strategies*
| Baseline strategy | Defensive strategy (a) | Defensive strategy (b) | |
| S&P 500 | 100% | 80% | 80% |
| Defensive sectors | 20% | 10% | |
| Gold | 10% | ||
| Total | 100% | 100% | 100% |
| Annualised returns | 7.0% | 7.7% | 8.4% |
| Volatility | 15.5% | 15.0% | 14.6% |
| Reward to risk | 45.3% | 51.4% | 57.2% |
| Drawdown | -50.6% | -48.0% | -44.1% |
*Based on data from December 1998 (due to data availability) to May 2023. Defensive sectors include Consumer Staples, Energy, Healthcare, Telecom, and Utilities. Hypothetical strategy invests in defensive strategy at the peak and disinvests at the trough.
Source: Bloomberg, World Gold Council
In sum…
Should the expected mild US contraction materialise, the strong first half for gold is likely to give way to a more neutral H2.
In this scenario, gold would draw support from a weaker US dollar and stable bond yields, although this would be met by downward pressure from cooling inflation. If history is a guide, monetary policy hold cycles tend to spell a higher-than-average monthly return for gold.
A more positive gold environment would result from a more pronounced economic downturn, thanks to an accompanying increase in volatility and risk-off appetite.
Conversely, gold would face challenges if tightening continues for longer than expected. Similarly, if a soft landing were engineered, it would favour risk-on assets and a stronger US dollar, likely resulting in gold disinvestment.
However, given the inherent uncertainty in predicting the global macroeconomic outcome, we believe that gold’s positive asymmetrical performance can be a valuable component to investors’ asset allocation toolkit.
Source: https://www.gold.org/goldhub/research/gold-mid-year-outlook-2023-between-and-soft-and-hard-place