Despite potential rate hikes, real rates remain low
Gold may face similar dynamics in 2022 to those of last year, as competing forces support and curtail its performance.
Near term, the gold price will likely react to real rates in response to the speed at which global central banks tighten monetary policy and their effectiveness in controlling inflation.
Yet, in our view:
- while rate hikes can create headwinds for gold, history shows their effect may be limited
- at the same time, elevated inflation and market pullbacks will likely sustain demand for gold as a hedge
- jewellery and central bank gold demand may provide additional longer-term support
Juan Carlos Artigas, Global Head of Research, World Gold Council, said; “The 2022 outlook for gold comes down to which dynamics will tip the scales. While factors like persistent inflation and jewellery demand are likely to be supportive, rising rates may create headwinds. Ultimately, even if gold’s price may fluctuate, its value as a highly liquid hedge remains consistent. This is an important attribute amidst ongoing Covid-related market volatility and an intensifying investor risk appetite.”
Higher rates in 2021 outweighed inflation risks
Gold finished the year approximately 4% lower, closing at US$1,806/oz.1 The gold price rallied into year-end on the heels of the rapidly spreading Omicron variant, likely prompting flight-to-quality flows, but it was not enough to offset H1 weakness.
Early in 2021, as newly developed vaccines were rolled out, investor optimism likely fuelled a reduction in portfolio hedges. This negatively impacted gold’s performance and resulted in gold ETF outflows. The rest of the year was a tug of war between competing forces. Uncertainty surrounding new variants, combined with increasing risks of persistently high inflation and a rebound in gold consumer demand, pushed gold forward. Conversely, rising interest rates and a stronger US dollar continued to create headwinds. However, dollar strength led to positive gold returns in some local currency terms, such as the euro and yen among others (Table 1).
Our gold return attribution model corroborates this. Rising opportunity costs were one of the most important contributors to gold’s negative performance in Q1, and intermittently in H2, while rising risks – especially those linked to elevated inflation – pushed gold higher towards the end of the year (Chart 1).
Chart 1: Rates and inflation were two the most important contributors to gold’s performance in 2021
Contributions of gold price drivers to periodic gold returns*Return
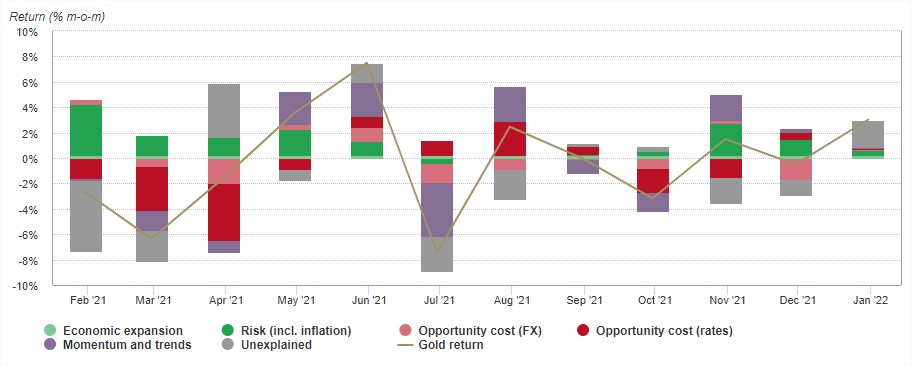
*As of 31 December 2021. Our short-term model is a multiple regression model of monthly gold price returns (based on XAU), which we group into the four key thematic driver categories of gold’s performance: economic expansion, market risk, opportunity cost, and momentum. These themes capture motives behind gold demand; most saliently, investment demand, which is considered the marginal driver of gold price returns in the short run. ‘Unexplained’ represents the percentage change in the gold price that is not explained by factors currently included in the model. Results shown here are based on analysis covering an estimation period from February 2007 to December 2021. On Goldhub, see: Short-term gold price drivers.
On Goldhub, see: Short-term gold price drivers
Table 1: Gold’s price performance was mixed across currencies
Gold price and annual return in key currencies*
| USD (oz) | EUR (oz) | JPY (g) | GBP (oz) | CAD (oz) | CHF (oz) | INR (10g) | RMB (g) | TRY (oz) | RUB (g) | ZAR (g) | AUD (oz) | |
|---|---|---|---|---|---|---|---|---|---|---|---|---|
| 2021 return | -4.30% | 3.30% | 6.70% | -3.10% | -4.00% | -1.10% | -2.60% | -6.70% | 67.70% | -3.40% | 4.10% | 1.80% |
| Year-end price | 1,806 | 1,594 | 6,686 | 1,338 | 2,309 | 1,650 | 43,210 | 370.2 | 23,522 | 4,335 | 928 | 2,490 |
| Annual average | 1,799 | 1,521 | 6,350 | 1,308 | 2,256 | 1,644 | 42,757 | 373.1 | 15,999 | 4,263 | 855 | 2,396 |
| Annual high | 1,943 | 1,649 | 6,868 | 1,431 | 2,476 | 1,734 | 45,651 | 403.8 | 32,423 | 4,627 | 950 | 2,566 |
| Annual low | 1,684 | 1,417 | 5,885 | 1,221 | 2,125 | 1,570 | 39,730 | 353.2 | 12,396 | 3,996 | 801 | 2,194 |
*As of 30 December 2021. Based on the LBMA Gold Price PM in local currencies: US dollar (USD), euro (EUR), Japanese yen (JPY), pound sterling (GBP), Canadian dollar (CAD), Swiss franc (CHF), Indian rupee (INR), Chinese yuan (RMB), Turkish lira (TRY), Russian rouble (RUB), South African rand (ZAR), and Australian dollar (AUD).
Source: Bloomberg, ICE Benchmark Administration, World Gold Council
Looking ahead, rising rates pose risks but the devil will be in the details
As we enter 2022, the US Federal Reserve is signalling a more hawkish stance. Its projections indicate that the Fed expects to hike approximately three times2 this year at a quicker pace than previously expected, while aiming to reduce the size of its balance sheet.
An analysis of previous tightening cycles, however, shows that the Fed has tended not to tighten monetary policy as aggressively as members of the committee had initially expected.
Chart 2: The Fed signalled a more hawkish stance in the previous tightening cycle than what was delivered
Projected mid Fed funds target rate versus actual*
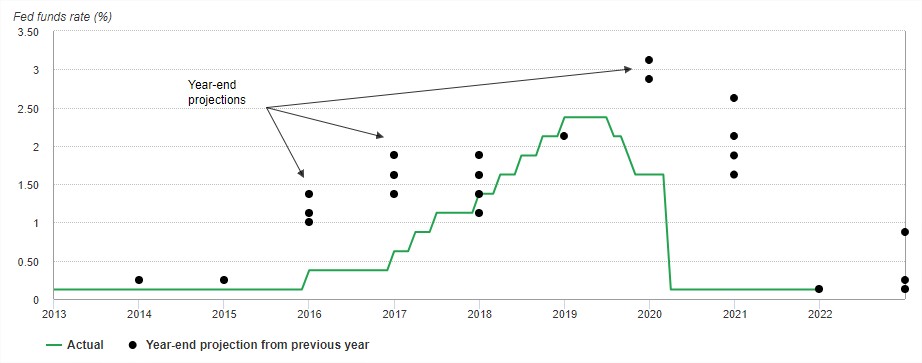
*As of 31 December 2021. Actual midpoint Fed funds target rate compared to Federal Open Market Committee (FOMC) member projections from the previous year. There may be up to four different end-of year projections if the FOMC members changed their expectations over the course of the year.
Dot-plot projections suggest that year-ahead Fed expectations have significantly exceeded actual target rates (Chart 2).
More importantly though, financial market expectations of future monetary policy actions – expressed through bond yields – have historically been a key influence on gold price performance.
Consequently, gold has historically underperformed in the months leading up to a Fed tightening cycle, only to significantly outperform in the months following the first rate hike (Chart 3). Gold may have partly been aided by the US dollar which exhibited the opposite pattern. Finally, US equities had their strongest performance ahead of a tightening cycle but delivered softer returns thereafter.
Chart 3: Gold has typically outperformed following the first rate hike of a Fed tightening cycle
Median return of gold, US stocks and US Treasuries over the past four Fed tightening cycles*
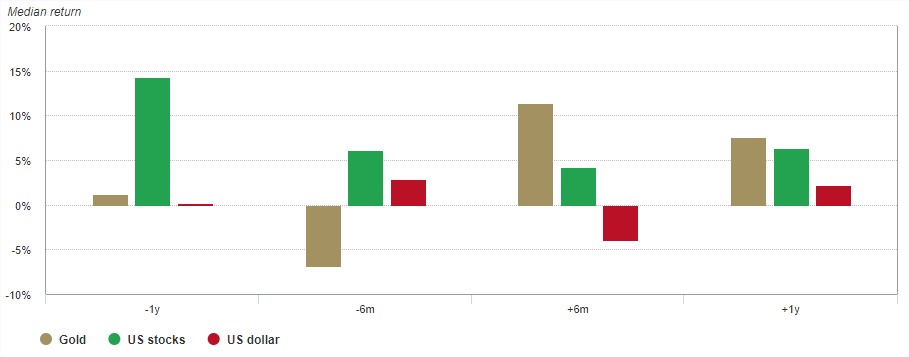
*Median returns based on the past four tightening cycles starting in February 1994, June 1999, June 2004 and December 2015. US dollar performance based on the Fed trade-weighted dollar index prior to 1997 and the DXY index thereafter, due to data availability.
Finally, while there’s a lot of emphasis on the relationship with US interest rates, gold is a global market. And not all central banks may move as quickly as the Fed.
For example, the European Central Bank has stated that it is “very unlikely” that interest rates will rise in 2022 despite recent record inflation prints. And while the Bank of England increased interest rates in December, its Policy Committee seemed to indicate only modest future rises.
The Reserve Bank of India has also signalled that it will maintain its accommodative monetary policy stance to revive and sustain economic recovery and mitigate the impact of COVID. And the People’s Bank of China cut one of its policy rates by 5bps in December shortly after lowering the required commercial banks reserve ratio to cushion the country’s economic slowdown.
While diverging monetary policies could result in a stronger dollar, steady or decreasing rates should support regional gold investment demand.
Opinion is divided, but inflation may linger
Many central banks initially played down inflation concerns, and while some, such as the Fed, have acknowledged upside risks, there’s an underlying expectation that inflation will dissipate.3 Investors seem to be less sure, but opinions vary.4 Anecdotally, these views were echoed in a LinkedIn poll we conducted last December. While the vast majority expected inflation to remain high, more than one in four respondents thought it would cool down.
We believe there are multiple reasons why inflation will remain high, partly stemming from the unprecedented monetary and fiscal policies put in place to alleviate the effects of the COVID-19 pandemic. In particular:
- lingering supply-chain disruptions from the initial COVID wave and subsequent dislocations as new variants continue to emerge5
- tight labour markets, which, combined with COVID fatigue, have increased the number of people voluntarily looking for new, better-paid opportunities
- higher average savings from 2020, which have contributed to lofty valuations in various financial markets
- high commodity prices.
Gold has historically performed well amid high inflation. In years when inflation was higher than 3%, gold’s price increased 14% on average (Chart 4).6 Further, in the long run, gold has outpaced US inflation and moved closer in pace to money supply, which has significantly increased in recent years (Chart 5).
Chart 4: Gold historically performs well in periods of high inflation
Gold and commodity nominal returns in US dollars as a function of annual inflation*
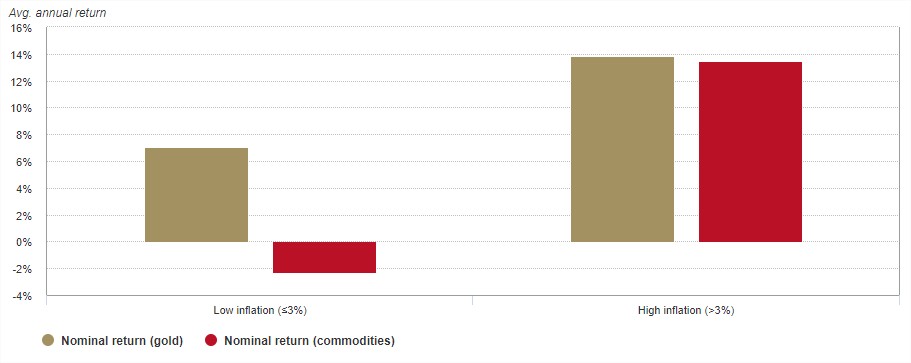
*As of 31 December 2021. Based on y-o-y changes in US dollars for ‘gold’: LBMA Gold Price PM, ‘commodities’: Bloomberg Commodity Index and ‘inflation’: US CPI since January 1971.
Chart 5: Gold has kept up with money supply growth
Gold (US$/oz), US M2, US CPI indexed: Q1 1971 = 100*
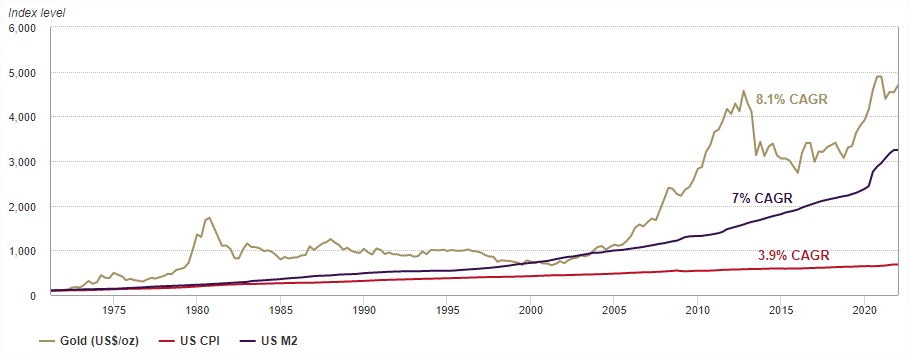
*As of 31 December 2021. Based on US M2 cumulative growth, US CPI, and LBMA Gold Price PM USD.
Amid opposing forces, real rates will likely remain low
Despite potential rate hikes by some central banks, nominal rates will remain low from a historical perspective. Even more so, elevated inflation will likely keep real rates depressed (Chart 6). This is important for gold since gold’s short- and medium-term performance tends to often respond to real rates, which combine two important drivers of gold performance: “opportunity cost” and “risk and uncertainty”.
Further, low interest rates – both nominal and real – are shifting investment portfolios more towards risk-on assets. And this, in turn, as we discuss in one of our recent reports,7 increases the need for a high-quality liquid asset such as gold.
Chart 6: Both nominal and real interest rates are at or near historically low levels
US 10-year Treasury nominal and real yield*
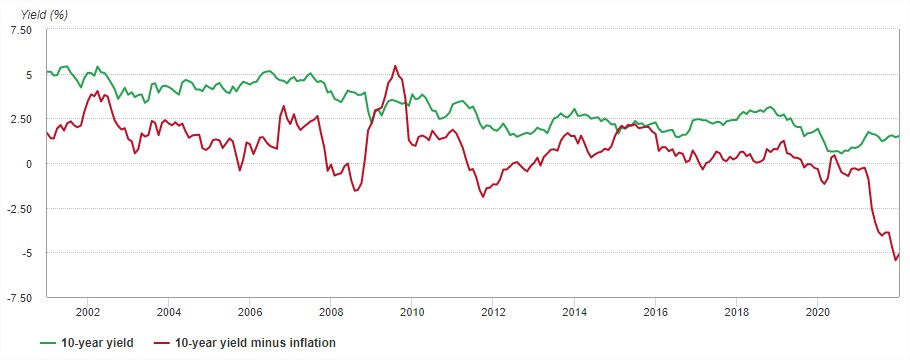
*As of 31 December 2021. Real yield computed using US 10-year Treasury nominal yield minus seasonally adjusted US CPI y-o-y change.
Investors are ready to turn the page on COVID, but market pullbacks may persist
It’s been two years since the start of the pandemic and the world seems ready to move on: global stock markets have strongly rebounded from their 2020 lows, albeit at different rates. But “tail events” have also been on the rise (Chart 7).
Chart 7: Pullbacks have become more frequent
Kurtosis of S&P 500 returns*

*As of 31 December 2021. Two-year rolling kurtosis based on weekly returns. Kurtosis, the standardised fourth central moment of a distribution, is a measure that indicates how often events in the tails of the distribution occur.
Pullbacks are likely to continue in the face of the seemingly endless stream of new variants, as well as simmering geopolitical tensions and overall buoyant equity valuations fuelled by a long-lasting ultra-low-rate environment. In this context, gold can be a valuable risk management tool in an investor’s arsenal. Gold has a proven historical record of mitigating the negative impact of equity market pullbacks in periods of systemic risk (Chart 8).
Chart 8: Gold tends to perform well in periods of significant market pullbacks
Performance of gold, US Treasuries and S&P 500 during VIX spikes*

*As of 31 December 2021. Dates used: Black Monday: 9/1987–11/1987; LTCM: 8/1998; Dot-com: 3/2000–3/2001; September 11: 9/2001; 2002 recession: 3/2002–7/2002; Great recession:10/2007–2/2009; Sovereign debt crisis I: 1/2010–6/2010; Sovereign debt crisis II: 2/2011–10/2011; 2018 Pullback: 10/2018–12/2018; 2020 pullback: 2/2020–3/2020. The VIX is available only after January 1990. For prior events we used realised 30-day S&P 500 volatility.
Gold’s performance is not only linked to investment
It is often assumed that gold’s price behaviour is linked to investment demand, especially from financial instruments such as gold ETFs, over-the-counter contracts, or exchange-traded derivatives. This is only partly true. Shorter-term and more significant price movements do tend to respond to variables associated with these types of gold investments; for example, interest rates, inflation, exchange rates, and, more generally, flight-to-quality flows.
However, our analysis shows that gold’s performance is also linked to other components of demand, such as jewellery, technology, and central banks. While these do not typically result in the large price movements associated with investment, they help underpin gold price performance by either providing support, or creating headwinds.
We believe that gold can still receive positive – if modest – support in 2022 from key jewellery markets, such as India. However, there’s a chance that further Chinese economic slowdown may limit the contribution from local gold jewellery demand.
Finally, central bank gold demand, which rebounded in 2021, may remain an important source of demand. There are good reasons why central banks favour gold as part of their foreign reserves which, combined with the low interest rate environment, continue to make gold attractive. This was also evidenced by the fact that two developed market central banks last year joined the list of buyers which has been dominated by emerging market banks since 2010.
Gold’s behaviour will depend on which factors tip the scale
Gold will likely face two key headwinds during 2022:
- higher nominal interest rates
- a potentially stronger dollar.
However, the negative effect from these two drivers may be offset by other supporting factors, including:
- high, persistent inflation
- market volatility linked to COVID, geopolitics, etc.
- robust demand from other sectors such as central banks and jewellery.
Against this backdrop, gold’s performance during 2022 will ultimately be determined by which factors tip the scale. Yet, gold’s relevance as a risk hedge will be particularly relevant for investors this year.
Investors can use QaurumSM, our valuation tool, to analyse how the impact of some of these key drivers may influence gold’s performance across a range of customisable hypothetical macroeconomic scenarios.8
Download the Gold Market Outlook for 2022
1Based on the LBMA Gold Price PM as of 30 December 2021. It should be noted that while a closing price for the LBMA Gold Price PM is not available for 31 December, gold rallied that day. Based on XAU – a commonly used proxy for spot gold price – gold finished slightly higher and up 3% in December.
2Dot-plot projections from the December 2021 meeting indicate a range between one and four hikes with a median of three.
3A divide in responses to the inflation threat, FT, December 2021.
4The Year of Inflation Infamy, Paul Krugman, NYT, December 2021;. Who Is Right about Inflation? Chicago Booth Review, August 2021; On inflation, it’s past time for team ‘transitory’ to stand down, Larry Summers, Washington Post, November 2021.
5Omicron, Supply-Chain Troubles to Slow Growth, World Bank Says, WSJ, 11 Jan 2022.
6Based on US CPI y-o-y changes from 1971 through 2021. There have been 25 observations each of greater than and less than 3% inflation.
7Increased appetite for less liquid investments strengthens the case for gold, December 2021.
8QaurumSM is a web-based quantitative tool powered by the Gold Valuation Framework (GVF). An academically validated methodology, GVF is based on the principle that the price of gold and its performance can be explained by the interaction of demand and supply. In turn, demand and supply are influenced by macroeconomic scenarios that can be customised to calculate gold’s implied performance based on these hypothetical conditions over various time periods. See Important information and disclosures at the end of this report.