
Special Economic Zones powered India’s gem and jewellery exports between April and October 2026, lifting their share of the sector’s total to 29.5%.
India’s gem and jewellery exports grew 7.32% year on year to US$17.23 bn between April and October 2026, according to GJEPC’s provisional trade statistics. But the headline number conceals an interesting divergence. Exports from Special Economic Zones (SEZs) grew more than four times as fast, rising 31.07% to US$5.09 bn. In absolute terms, that represents an additional US$1,206.56 mn over the corresponding period last year.
The consequence is a significant change in the composition of exports. SEZs now account for 29.5% of India’s gross gem and jewellery exports, compared with 23.7% a year ago. Their contribution has increased by nearly six percentage points in just seven months. This is worth examining because the growth of an export sector depends as much on where and how goods are produced as on the markets in which they are sold.
The geographical distribution of exports tells its own story. Mumbai SEEPZ remains the largest contributor, with shipments of US$2,903.87 mn, up 49.93%. Surat recorded exports of US$1,110.68 mn, an increase of 54.57%. Kolkata, though smaller in absolute terms, registered the highest growth among the major zones, with exports rising 70.80% to US$386 mn. Cochin grew 31.75% to US$25.92 mn, while Chennai SEZ recorded exports of US$0.38 mn against no exports in the corresponding period last year.
For Kirit Bhansali, Chairman, GJEPC, the numbers point to the strength of India’s manufacturing base and its ability to respond to global demand. “The 31.07% growth in SEZ exports is an encouraging indicator of the sector’s manufacturing strength and its ability to respond to global demand. These zones provide exporters with an environment that supports scale, operational efficiency and access to international markets. The strong performance of Mumbai SEEPZ, Surat and Kolkata reflects the contribution of these manufacturing centres to India’s export growth. As we work towards expanding the country’s gem and jewellery exports, strengthening SEZ infrastructure and improving the ease of doing business will remain important priorities.”
The growth is not confined to the manufacturing centres. SEZ exports to the United States rose 74.12%, while shipments to Hong Kong increased 81.19%. These are important markets for the industry as a whole. Gross gem and jewellery exports to the US grew 14.91% during the period, while exports to Hong Kong rose 18.8%. The substantially faster growth in SEZ shipments to both destinations suggests that these zones are playing an increasingly important role in meeting international demand.
Studded Gold Jewellery with Diamonds: Country-wise Performance
April–October 2026
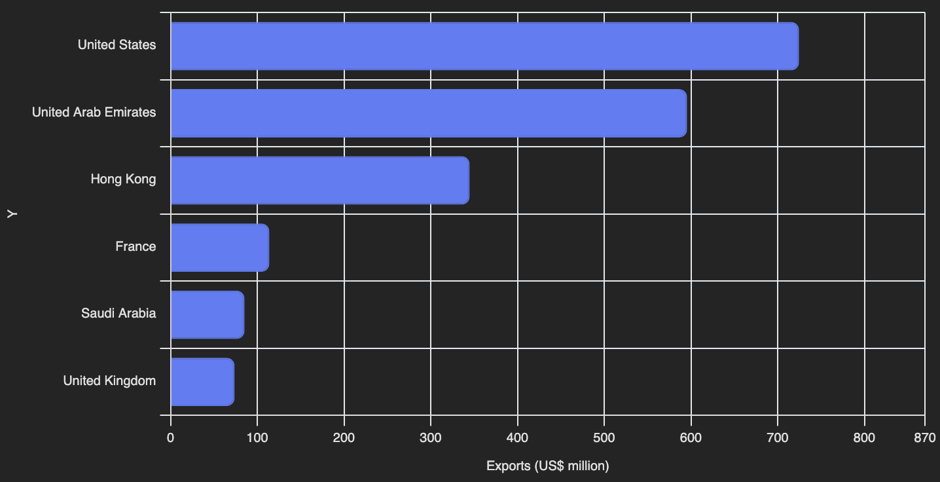
Studded gold jewellery with diamonds recorded strong growth across several key markets during April-October 2026. Exports to the United States rose 45.14% to US$724.63 million, while shipments to the United Arab Emirates increased 19.81% to US$595.54 million. Hong Kong recorded the sharpest rise among the destinations listed, up 233.98% to US$344.84 million. Exports to the United Kingdom grew 28.41% to US$73.85 million and those to France edged up 5.30% to US$113.96 million. Saudi Arabia moved against the trend, with shipments declining 12.96% to US$85.31 million.
The larger point is that SEZs are growing faster than the industry they serve, steadily increasing their share of India’s export business. The trend makes their performance an important part of any assessment of the sector’s prospects. For an industry competing in a demanding global marketplace, the ability to manufacture at scale, operate efficiently and deliver to international buyers will matter as much as market access itself. The latest figures suggest that SEZs are making a growing contribution on that front.